
Science
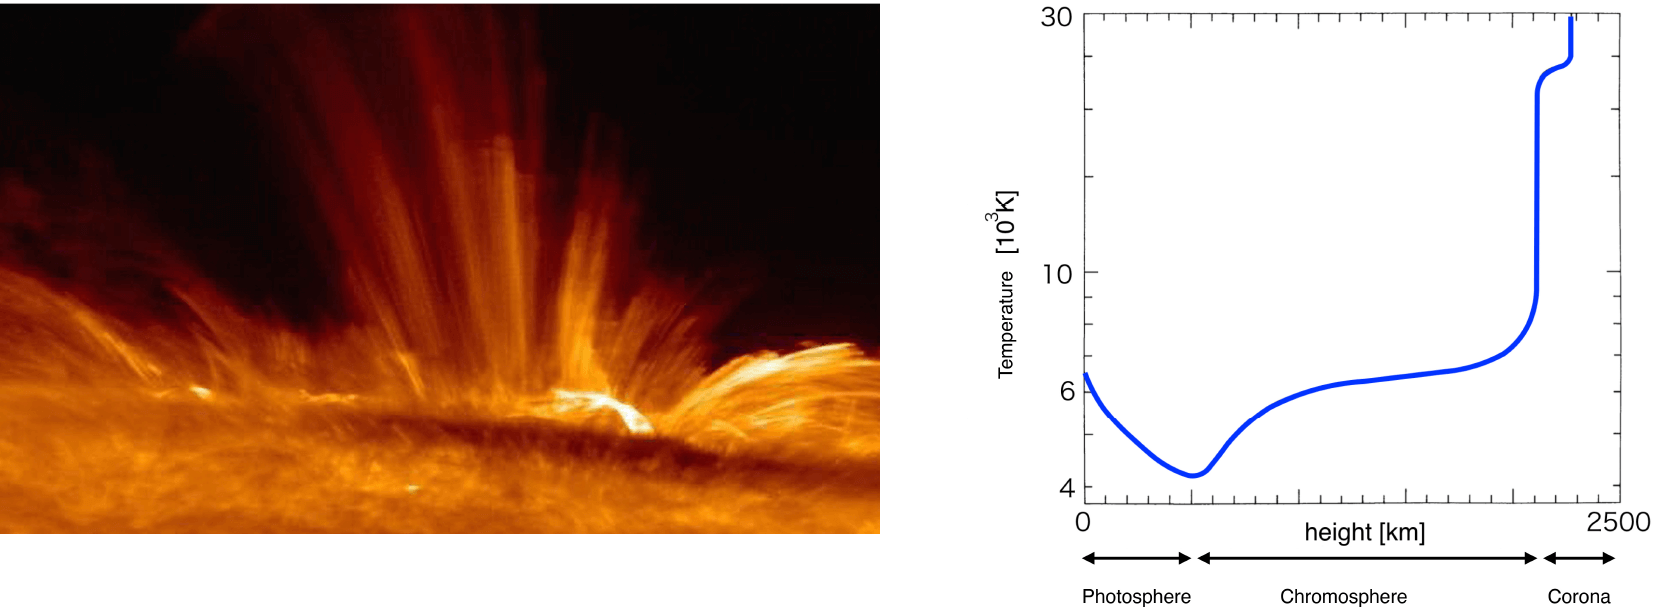
Structure of the solar atmosphere
The temperature distribution of the Sun is as follows. The solar surface, called photosphere, has a temperature of 6000 °C. Directly above the photosphere, the chromosphere and corona have temperatures of about 10,000 °C and 1,000,000 °C, respectively. As one moves away from the heat source (the solar center), the temperature should decrease. But as actually seen in the Sun, the temperature distribution is reversed. What is happening? It is thought that the magnetic field on the solar surface plays a role on that. The magnetic field extends upwards from the photosphere (chromosphere and corona), and some parts even spread into interplanetary space. A major characteristic of the magnetic field is that it can store energy. It is believed that the energy generated by the gas motion on the solar surface is stored in the magnetic field and transported to the chromosphere and corona, where it is released. Recent observations of the chromosphere, such as those made by the solar-observing satellite HINODE, have revealed that it is a highly dynamic and active space. It is an atmospheric layer where shock waves, jets, and countless waves propagate. How do these phenomena propagate energy from the solar surface and release it in the chromosphere? SCIP is attempting to unravel these mysteries.
World's first airbone simultaneous polarimetric spectroscopic observations of the solar photosphere and chromosphere!
One of the characteristics of SCIP is that it measures many spectral lines. The light from each spectral line is emitted at a different height in the solar atmosphere. In other words, light from one spectral line may be emitted higher in the solar atmosphere, while light from another spectral line may be emitted lower. Therefore, by observing those spectral lines simultaneously, it is possible to obtain information about the solar atmosphere at multiple heights. SCIP observes two near-infrared wavelength bands (770 nm and 850 nm) simultaneously. These bands contain many spectral lines, each emitted at a different height in the solar atmosphere. For example, the neutral iron line Fe I 846 nm is emitted from the solar photosphere. The ionized calcium line Ca II 854 nm is a spectral line emitted from the chromosphere. Additionally, it is also included the neutral potassium line (K I 766 nm), which is located at an intermediate height (the minimum temperature layer). Thus, from the two near-infrared spectral lines observed by SCIP, a lot of information about the solar atmosphere at many heights can be simultaneously analyzed. In this way, we can capture the three-dimensional magnetic field structure of the solar atmosphere from the photosphere to the chromosphere.
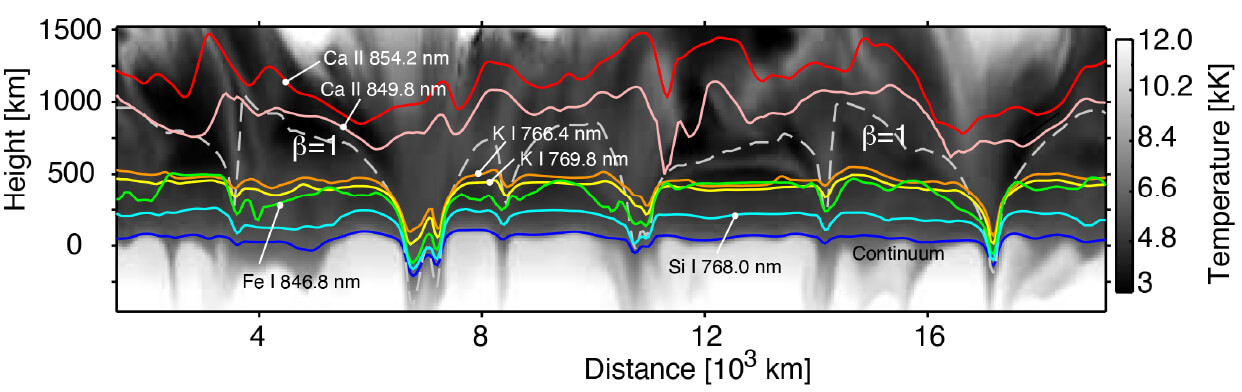
Solar atmosphere characterization capabilities with SCIP
In the figure, using a numerical simulation of the solar photosphere and chromosphere, it is represented what altitude information can be obtained. Each color solid line in the figure indicates the altitude influence of each spectral line. This shows that the coverage is seamless from the solar surface (0 km) up to 1500 km above. Even 6 spectral lines alone are enough to connect from the photosphere to the chromosphere. For example, if a wave is generated on the solar surface and propagates upward, it is possible to capture how it gradually moves from the photosphere to the chromosphere.
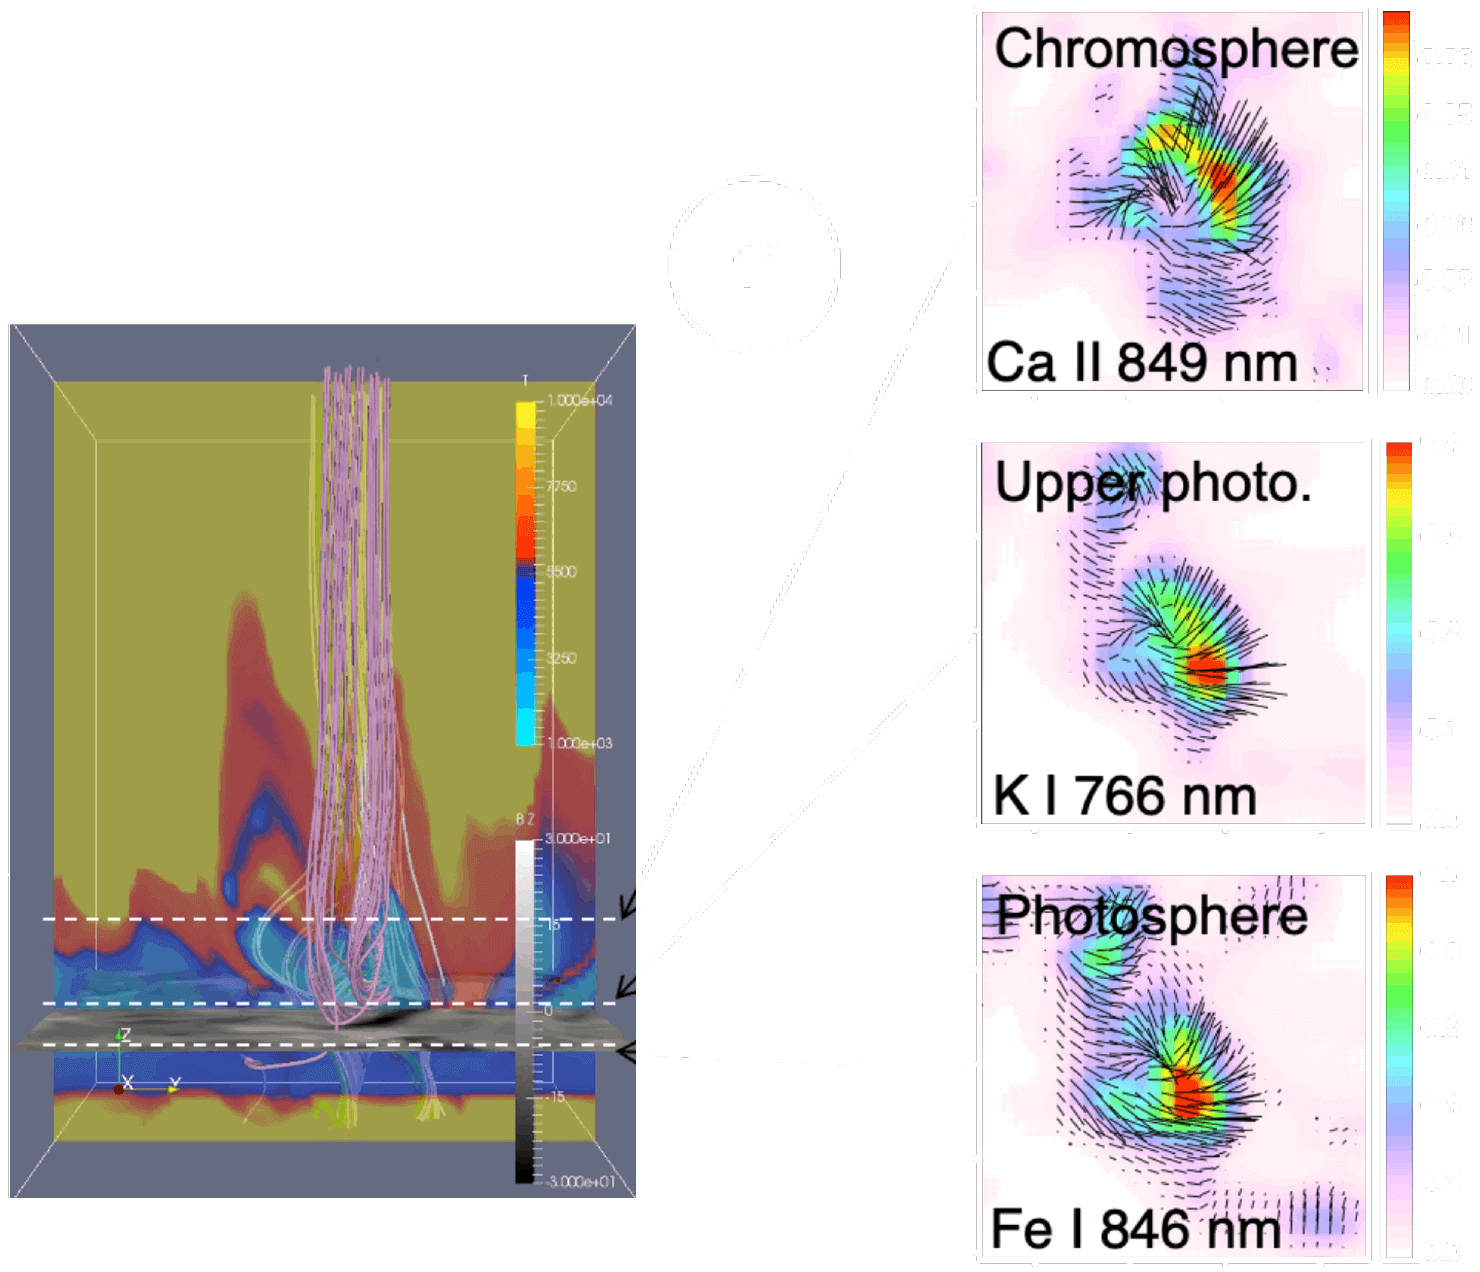
Simulation of solar magnetic activity phenomena observed with SCIP
SCIP is expected to capture the diverse physical phenomena occurring in the solar atmosphere. In the figure, a simulated observation of jet structures ocurring in the solar atmosphere is shown as an example. On the left-hand side of the figure, it is represented a numerical simulation of a twisted magnetic field structure driving the jet. On the right-hand side, based on this atmospheric state, the polarization signal that would be measured by spectro-polarimetric observations using SCIP, is shown. The black line represents the polarization signal, which indicates the direction of the magnetic field. Thus, it is expected to capture how the twisted magnetic field structure changes with the height. This is an example of a jet, but detailed observations of other phenomena such as waves and magnetic reconnection are also expected.